Business Cycle Indicators – Employment and Coincident Index
Source ↗
👁 1
💬 0
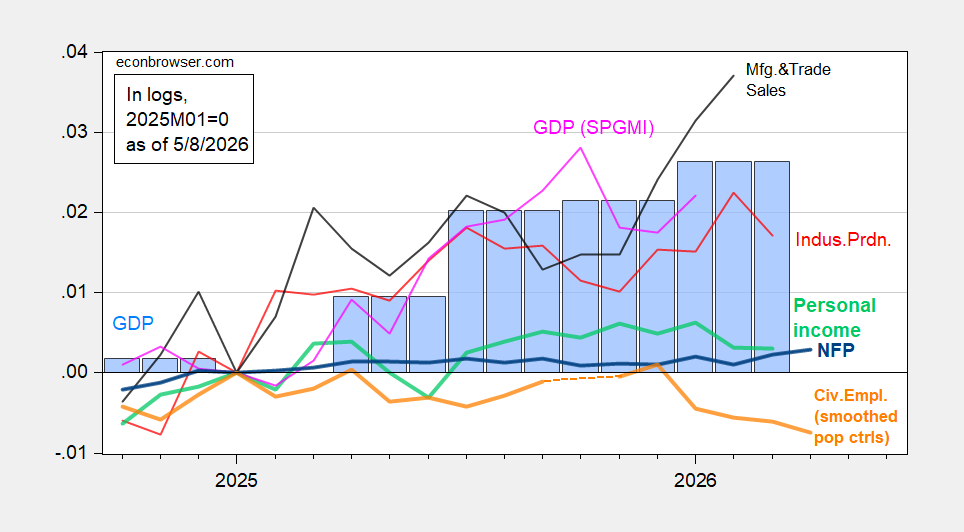
NFP up, but household survey series down.
Figure 1: NFP employment (bold blue), civilian employment with smoothed population controls (bold orange), industrial production (red), personal income excluding current transfers in Ch.2017$ (bold light green), manufacturing and trade sales in Ch.2017$ (black), and monthly GDP in Ch.2017$ (pink), GDP (blue bars), all log normalized to 2025M01=0. Source: BLS via FRED, BLS, Federal Reserve, BEA 2026Q1 Advance release, S&P Global Market Insights (ne
Figure 1: NFP employment (bold blue), civilian employment with smoothed population controls (bold orange), industrial production (red), personal income excluding current transfers in Ch.2017$ (bold light green), manufacturing and trade sales in Ch.2017$ (black), and monthly GDP in Ch.2017$ (pink), GDP (blue bars), all log normalized to 2025M01=0. Source: BLS via FRED, BLS, Federal Reserve, BEA 2026Q1 Advance release, S&P Global Market Insights (ne

Comments (0)